Server Timing Trace
Tracing requires server admin rights, if you do not have admin rights the trace buttons will be disabled
The standard timings reported in the output window is the elapsed time for the query recorded by Dax Studio, but that can be impacted by network speeds and the size of the result set. If you want to see the query timing from the server perspective you can do this with the server timing trace button.
This button causes an extra tab to be displayed which shows the total time the server spent processing the query as well as the time spent in the Storage Engine and the number of Storage Engine requests for the query.
| Metric | Description |
|---|---|
| Total | This is the total query duration in milliseconds – taken from the Query End profiler event. This is the total time the server took to process the query. (so it will exclude any time the client took to process the result set) |
| SE CPU | This is the amount of CPU time that was spend on Storage Engine queries (note that this figure may not be 100% reliable, so don’t place a high amount of importance on it) the blue ratio under SE CPU is the factor of SE CPU over SE and is a very rough indicator of the average parallel operations that the SE was running. This figure is calculated by adding up the CPU duration from the Storage Engine events |
| FE | This is the amount of time spent in the Formula Engine, calculated by Subtracting the SE duration from the Total. The blue figure underneath is the percentage of FE / Total |
| SE | This is the amount of time spend in the Storage Engine, calculated by adding up the duration of all the Storage Engine queries. The blue figure underneath is the percentage of SE / Total. As a rough rule of thumb you want to try to get your queries to spend more time in the Storage Engine as it is multi-threaded so can do more operations in parallel. While the Formula Engine is single threaded and cannot make use of multiple CPU cores. Note that you cannot have a query that is 100% handled in the storage engine as the FE sits over the top of the SE. The FE is what issues the requests to the SE and it also serializes the result set before it is sent back to the client |
| SE Queries | this is the number of Storage Engine queries that were performed during the processing of the query |
| SE Cache | this is the number of Storage Engine cache hits |
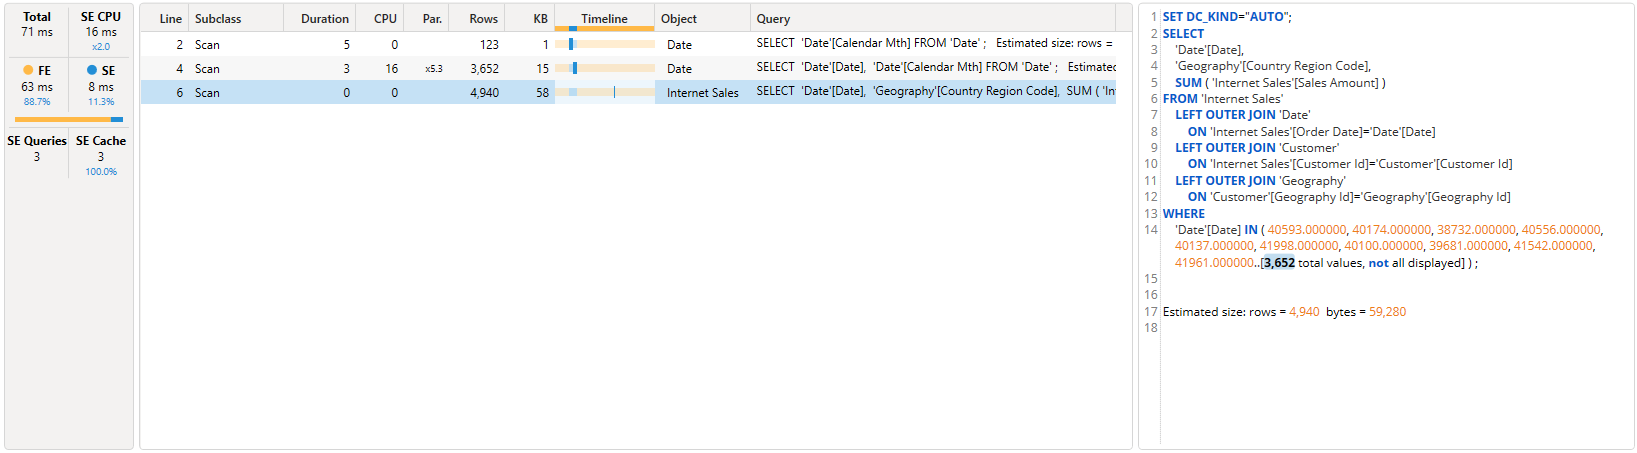
You may also wonder what that “SQL like” query is that captured by the scan event when running a query against an import mode model. This is called xmSQL and is textual representation of the requests that the Formula Engine sent to the Storage Engine. There is no way of executing these queries, they are merely a textual representation of the requests sent to the Storage Engine to enable people to understand what operations the storage engine was performing. When your data model is in Direct Query mode you will see a generic T-SQL query which may be transformed into a more data source specific query before it is executed against the actual data source.
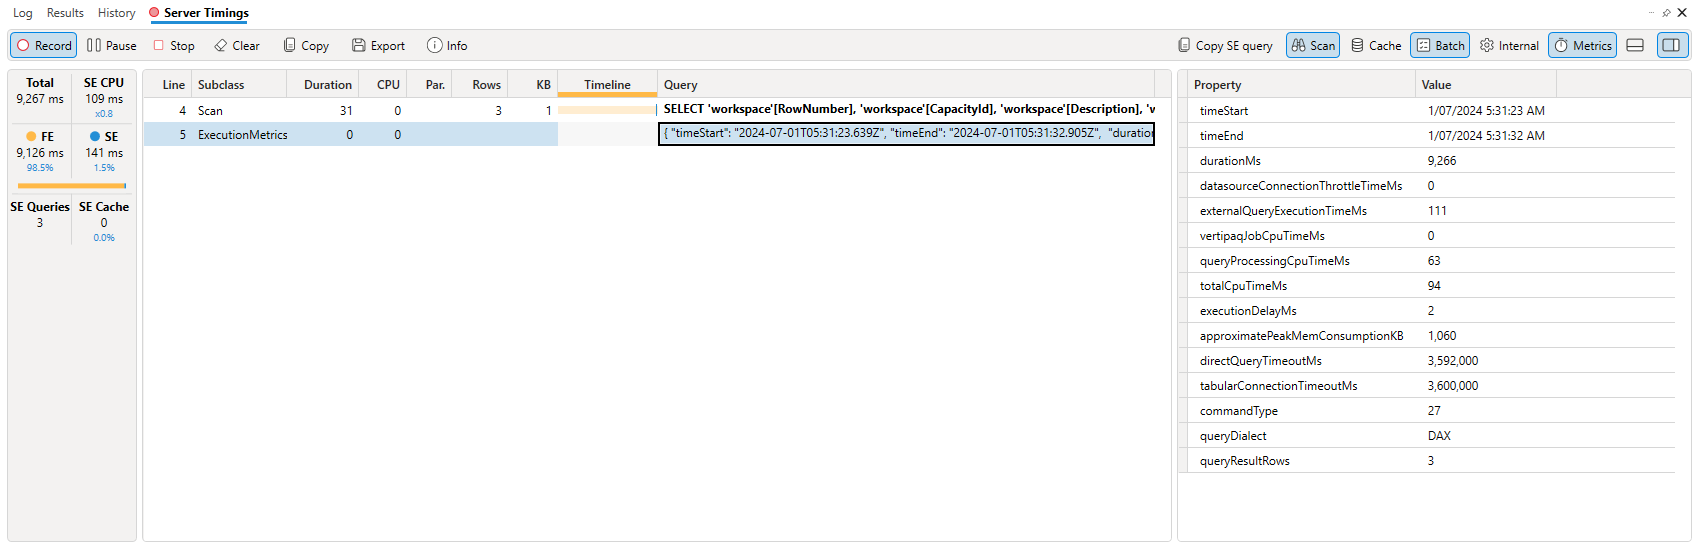
Execution Metrics events
Some data sources like the XMLA endpoint for the Fabric / Power BI service can now emit ExecutionMetrics events. These events output a collection of metrics that can vary based on the type of event. For query events like those captured by server timings these events show information about the query execution such as.
- Number of rows processed for queries and refresh.
- Time a request got delayed due to capacity throttling.
- Time to establish a connection to data source.
- Approximate memory and CPU consumption.
These events were announced in the following blog post
As of July 2024 only the XMLA endpoint on the Fabric / Power BI cloud service exposes these events