When enabled, DAX Studio will notify you when a new pre-release (preview) build is available, in addition to stable releases. Pre-release builds may contain new features that are still being tested. See Version notifications
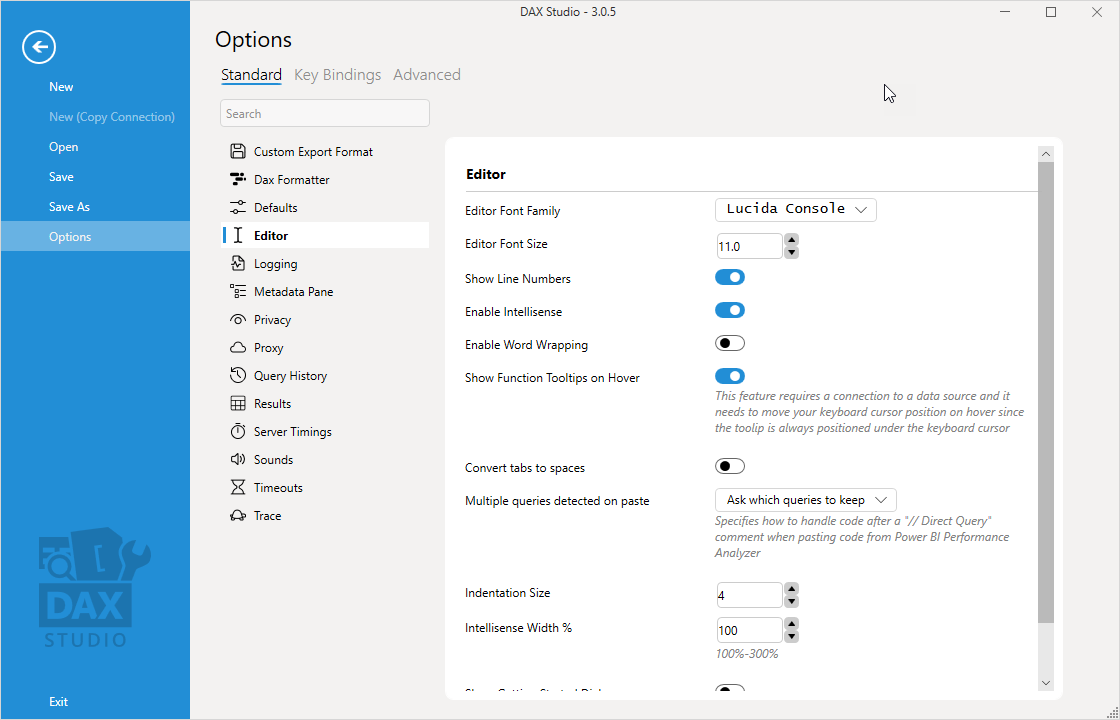
These settings control the display and behaviour of the main editor window
Setting
Description
Default
Editor Font Family
Sets the font used by the Query Editor pane
Lucida Console
Editor Font Size
Sets the default font size (in points)
11pt
Show Line Numbers
controls whether line numbers are displayed
true
Show Whitespace
controls whether whitespace characters are displayed
false
Show Control Characters
controls whether control characters are displayed
false
Enable Intellisense
whether to display Intellisense options while typing in the query editor
true
Enable Word Wrapping
whether to word wrap the query editor so that the horizontal scroll bar is not used
false
Convert Tabs to Spaces
if this setting is TRUE hitting the tab key will insert spaces instead of a tab character. The number of spaces inserted is controlled by the Indentation Size setting.
False
Indentation Size
This is the number of spaces to insert if Convert tabs to spaces is set to TRUE.
1
Intellisense Width
this option can be used to increase the default size of the intellisense dropdown window
100%
Show Getting Started Dialog
Controls whether the Getting Started Dialog is shown when you first connect to a data source
Stops DAX Studio from all external access. This option can only be set by an administrator during an 'All Users' install and overrides all the other options below. (and they will show up as disabled when this option has been set)
false
Block Version Checks
Stops DAX Studio from checking for and notifying of available updates
false
Block Crash Reporting
Stops DAX Studio from sending crash reports to the developer. There is a small chance that the screenshot of the crash could include personal information. Although you can untick the option to include the screenshot in the report if this is the case.
false
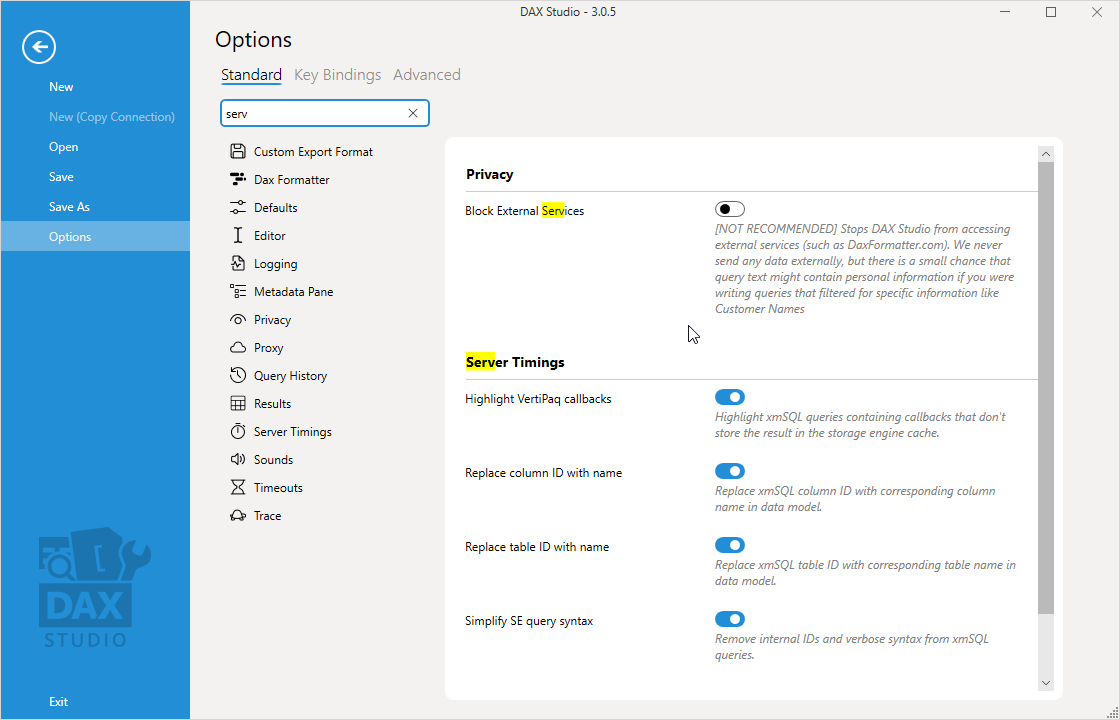
Block External Services
Stops DAX Studio from accessing external services (such as DaxFormatter.com). We never send any data externally, but there is a small chance that query text might contain personal information if you were writing queries that filtered for specific information like Customer Names
This setting adds extra metadata to the excel file which helps compatibility with more external applications that read xlsx data, but it does also increase the file size.
True
Use Zip64
Enables writing xlsx files larger than 4Gb, but not all client applications may be able to read these files
These settings control the length of various timeouts for potentially long running operations
Setting
Description
Default
DAX Formatter Request Timeout
DAX Studio sends a background request https://daxformatter.com this setting controls how long we wait before we consider the request as failed and log an error
10 sec
Power Pivot model detection Timeoue (sec)
This is the number of seconds DAX Studio will wait for a response from Excel while trying to determine if the active workbook has a data model
30 sec
Server Timings End Event Timeout
The trace events in the tabular engine are raised on a low priority background thread and occasionally if the server is very busy some events can be discarded. This setting controls how long DAX Studio will wait for a queries final QueryEnd event before it gives up and logs a warning. For high latency connections (such as Azure AS and the Power BI XMLA endpoint) you may need to increase this setting.
15 sec
Trace Startup Timeout
When DAX Studio starts a trace it periodically "pings" the server with an empty command. It then waits until the trace captures one of these requests before it considers the trace to be fully active. This setting controls how long DAX Studio will wait to see one of these "ping" requests before it stops waiting and logs and error. For high latency connections (such as Azure AS and the Power BI XMLA endpoint) you may need to increase this setting.
This setting controls the behavours of the various tracing features.
Setting
Description
Default
Legacy DirectQuery Trace
This setting controls whether tracing of DirectQuery Events is enabled for connections to servers with a version number earlier then 15.0 (SSAS 2017). For older servers the DirectQuery events do not allow per session filtering on the server so we have capture events from all sessions and apply filtering in DAX Studio. This places much more load on both the client and server which is why this option is off by default. If you need to enable it we recommend keeping any traces running for as short a time as possible
this option will include a copy of the current data model's .bim file (which is just metadata) in the .vpax file
True
Read Statistics from data
This will cause Vertipaq Analyzer to issue more accurate, but more expensive queries to the data source
True
Read statistics from DirectQuery tables
Specifies whether or not to gather statistics from DirectQuery tables
False
Direct Lake Behaviour
Determines how the Read statistics from data behaves for Direct Lake models more details
ResidentOnly
Sample Referential Integrity
The number of example missing keys to display. Note: these are only shown when viewing metrics, when you save a vpax file this information is not included
3
Do not show options dialog
Specifies whether to show the Options dialog when viewing or exporting metrics. This setting can also be set when the user ticks the option to not show this dialog again
False
Statistics Column Batch Size
The number of columns to include in each batch when collecting statistics. For large Direct Lake models it may be necessary to reduce this amount to avoid out of memory issues
50
Table/Column name display in Columns tab
Specifies how the table & column names are shown in the Columns tab
Show Debug Commas - turning this option on replaces the Swap Delimiters command in the ribbon with the Debug Commas command
Show XMLA Commands - will show command events in the All Queries trace
Show Delta Analyzer - enables the Delta Analyzer tool window, which reads Delta table metadata from OneLake for Direct Lake models. Once enabled the Delta Analyzer button appears in the Metrics group on the Advanced ribbon tab.
The Delta Analyzer is a preview feature, so its user interface may change before the final release.
These preview options control the two diagram features. Both are turned off by default, and turning one on makes its button appear in the ribbon.
Setting
Description
Default
Show Storage Engine Dependencies
Shows the Dependencies button in Server Timings, which opens the Storage Engine Dependencies diagram of the table and column relationships used by the Storage Engine queries
False
Show Model Diagram
Enables the Model Diagram, which visualises the data model structure including tables, columns and relationships. Adds a Model Diagram button to the Model group on the Advanced ribbon tab
False
Model Diagram Column Stat
Which statistic to show against columns in the Model Diagram. One of None, Cardinality or Size. Requires Model Metrics data, so you need to run View Metrics first
Cardinality
Model Diagram Column Sort
How columns are sorted within each table in the Model Diagram. One of Name, Cardinality ↓ or Size ↓. Sorting by cardinality or size requires View Metrics data
Name
Model Diagram Layout
The algorithm used to arrange the tables. One of Auto, Hierarchy, Grid, Clustered or Force Directed. Auto picks one based on the number of tables - Hierarchy for 15 or fewer, Grid for 16-50, and Clustered for more than 50
Auto
SE Dependencies Heat Map Mode
The metric used to colour the table headers in the Storage Engine Dependencies view. One of CPU Time, Hit Count or Row Count. CPU Time is usually the most useful for finding performance bottlenecks
CPU Time
Show Diagram Debug Button
Shows a Debug button in both diagram views for exporting diagnostic information. This is mainly useful when reporting an issue with one of the diagrams
False
Both diagram features are preview features, so their user interfaces may change before the final release.