v3.1.0 Release
Today we are happy to announce the release of version 3.1.0 of DAX Studio which includes the following fix.
Highlights
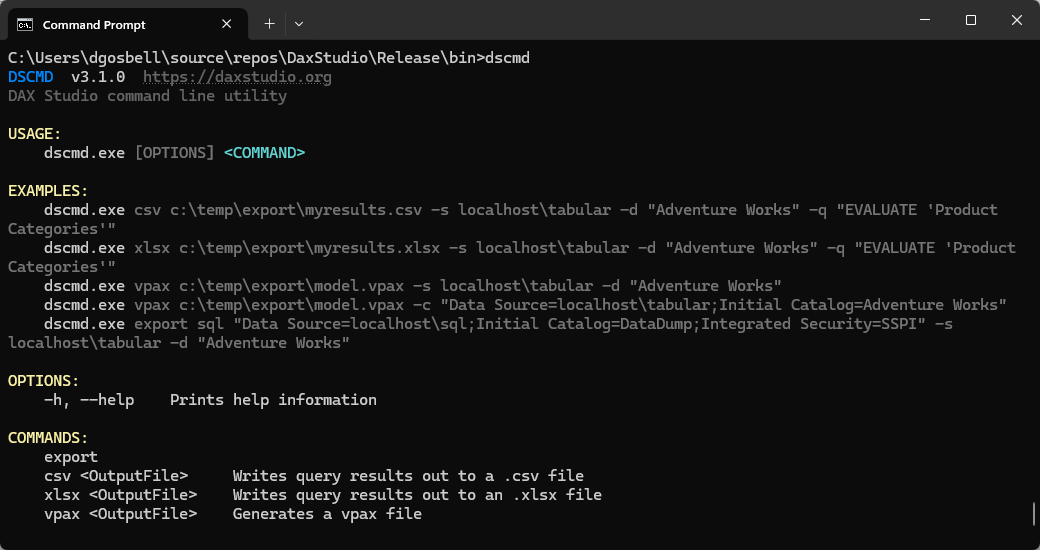
DSCMD - DAX Studio command line utility
DAX Studio is now shipping with a new utility called dscmd.exe this tool is a command line utility so you can run a subset of common operations from a command line.
This means that you can schedule tasks or run them as part of automated build pipelines. Learn more

Capture Diagnostics
This feature provides an easy way to capture Server Timings, Query Plan and Model Metrics with a single click. This works for a single query in the editor or you can run this over the current set of queries in an All Queries trace or from imported Power BI Performance data. If you are using the All Queries or Performance Data option only queries matching the filter conditions are captured so you can do things like only capture diagnostics for queries that run longer than 100ms. Learn More

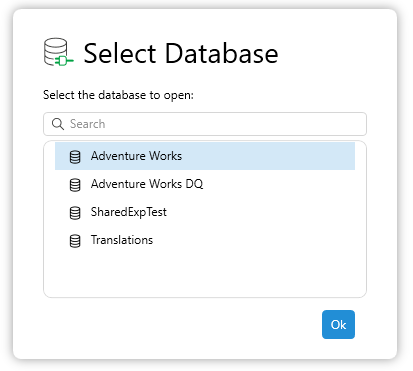
Database dialog
When connecting to a server with a lot of databases like a Power BI workspace / Fabric it can be frustrating to wait for the first database in the list to populate its metadata and then have to change to one of the other database and wait again for the metadata. Now if it detects multiple databases DAX Studio will display a list of them so that you can select the one you wish to connect to. The list is sorted alphabetically and has a search box to help quickly locate a specific semantic model Learn more

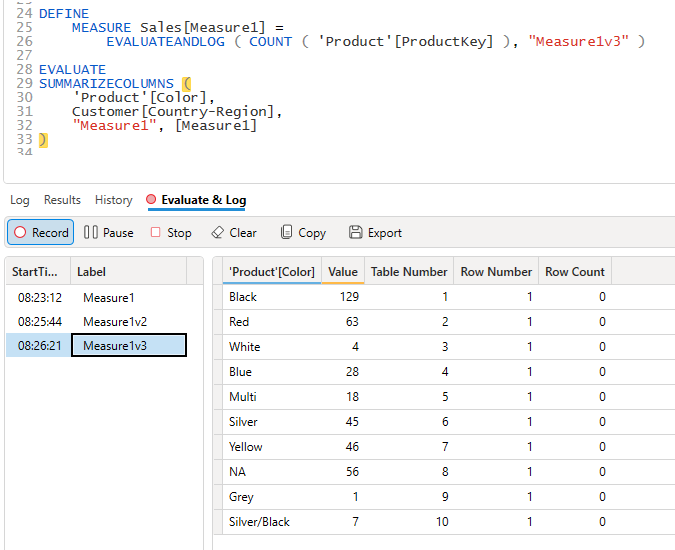
EvaluateAndLog Trace
The EvaluateAndLog function in DAX provides a way to get visibility of intermediate result sets that are used when evaluating DAX expressions. These can be helpful in diagnosing logic issues. Learn more

Execution Metrics added to Server Timings
The new ExecutionMetrics events are now visible in Server Timings if your data source is capable of emitting those events. Learn more

Full Change List
New Features
- Added Capture Diagnostics
- Added Evaluate and Log trace
- Added Database dialog when connecting
- Added command line support
- Added Model Metrics / Vertipaq Analyzer Options dialog
- Added support for obfuscated model metrics
- Added support to Server Timings for the new ExecutionMetrics event
Improvements
- #1204 made listview selected row color lighter to improve the contrast
- #1124 Improved labelling of the zoom level
- #1241 Added "learn more" link to connection dialog
- Added storage mode column to the Partitions tab in View Metrics
- updated TOM, ADOMD and other 3rd party dependencies
- Fixed the images for the Server Timings event type filters
- Moved Server FE Benchmark out of preview status
Fixes
- Fixed a crash trying to show fonts in the option dialog
- Fixed #1213 Formatted file export not applying formatting
- Fixed loading of AggregateRewrite events in saved Server Timings
- Fixed occasional crash when using publish functions
- Fixed #1228 Query Builder not respecting delimiter setting
- Fixed #1179 reconnect active traces on connection retries
- Fixed an issue in QueryBuilder when loading a saved query containing a hierarchy
- Fixed an issue in QueryBuilder when trying to filter on a query scoped measure
- Fixed an issue where the Ribbon buttons get stuck in a disabled state after an error while a trace is active
- Fixed #1262 ViewAs not working with "Other User" option against the Power BI Service
- Fixed #1264 Status bar timer stopped too early
- Fixed #1268 where the View As dialog did not work properly with a large number of roles
