v3.5.2 Release
· One min read

Updates
- removed unneeded dependencies
- improved app startup performance
- improved performance when opening large daxx files
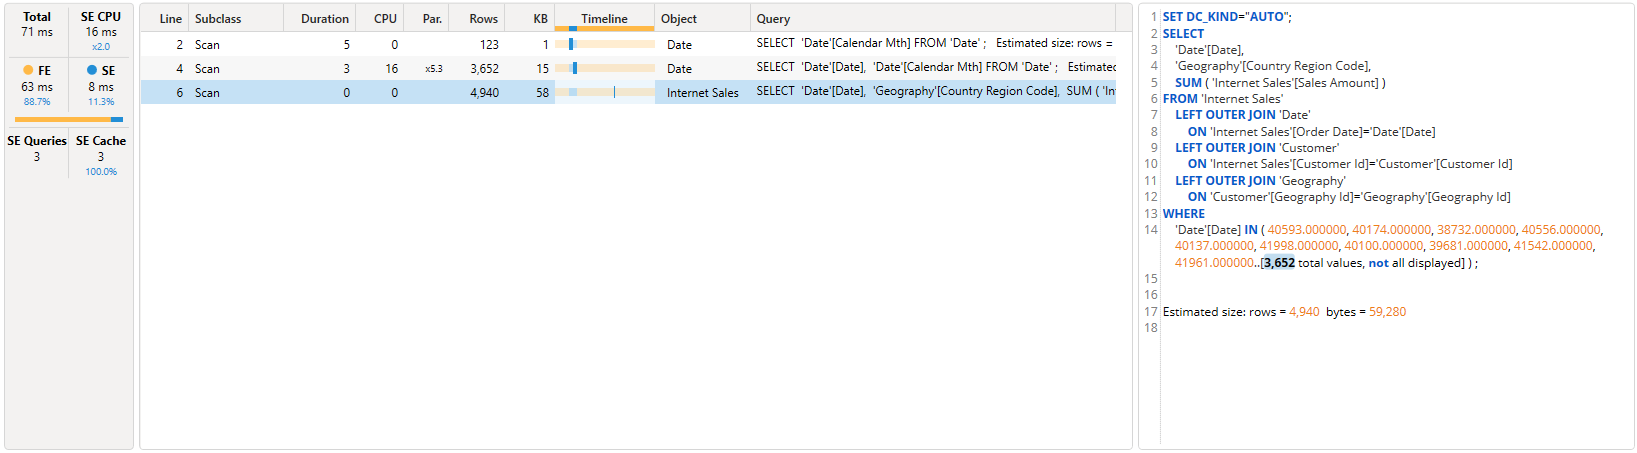
- improved server timings row highlighting
Fixes
- Fix #1439 adding FUNCTION as a keyword
- Fix #1440 parquet export failing with method or operation not implemented
- Fix #1442 errors in dscmd when using special characters in connection string
- Fix #1443 hang on server timings with extremely long lines
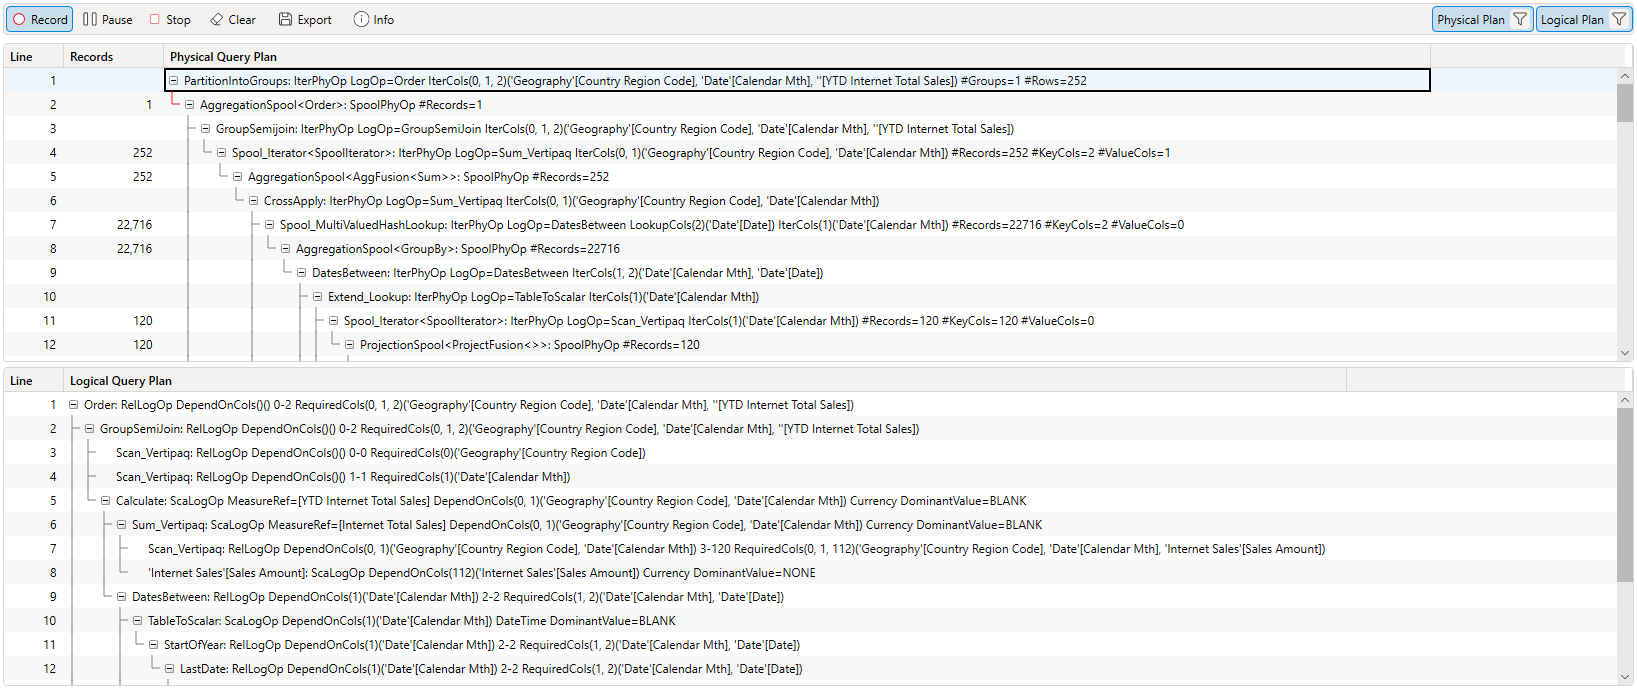
- Fix #1444 Query Plan not updating after being hidden
- Fix #1445 SQL Profiler not detected when using SSMS 22
- Fix #1446 Repeat calls to Capture Diagnostics failing
- Fix crash when copying hyperlink in error logs